

Strategic vs Operational Dashboards in Facility Management
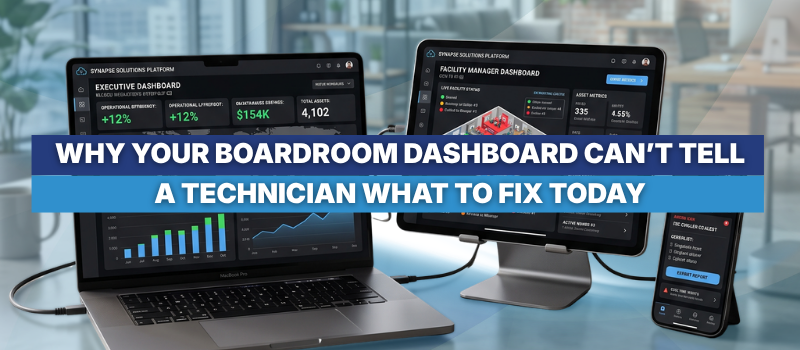
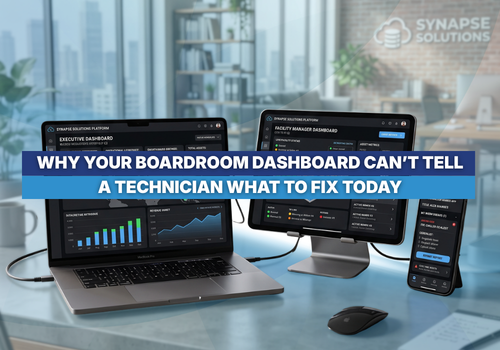
Why Your Boardroom Dashboard Can’t Tell a Technician What to Fix Today
A chiller trips at 2am. A tenant reports a leak on the fourth floor. A contractor marks a job complete that clearly isn’t finished. None of this shows up on the dashboard projected in the boardroom, because that dashboard was never built to catch it.
Facility teams now have more data available to them than at any point before: asset performance histories, tenant records, maintenance logs, vendor scorecards. Yet when something breaks, the people closest to the problem often can’t get a straight answer to who’s already on it, whether the job is on track to meet its SLA, or whether the same fault has quietly come up before.
That gap between having data and having answers is where most facility operations quietly lose time.
Why the Gap Exists
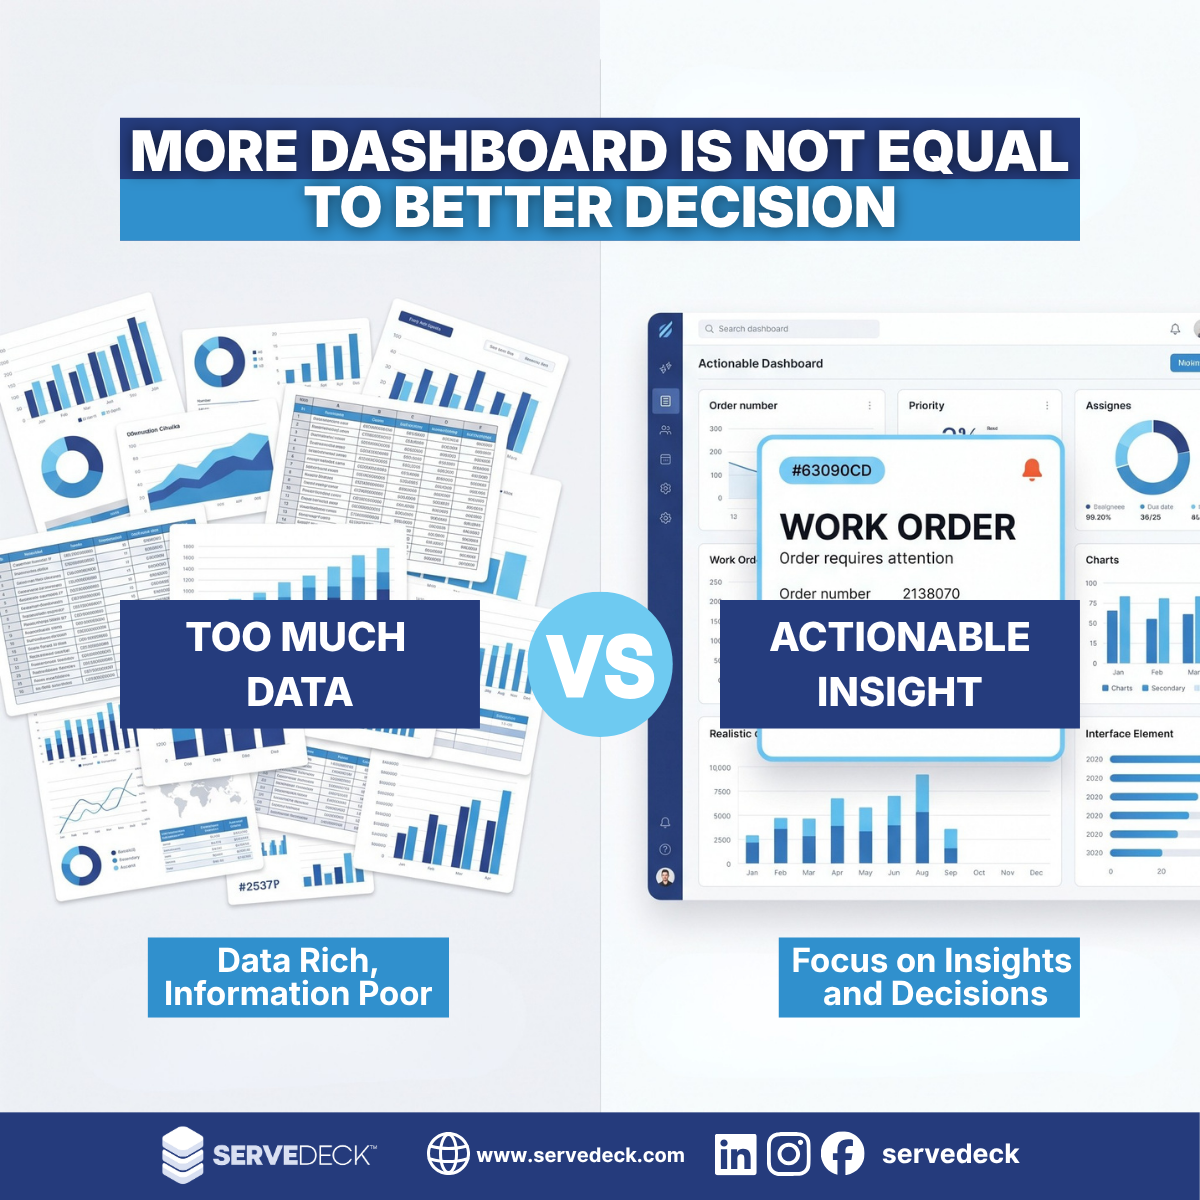
The instinct when data feels scattered is to consolidate it, usually into a strategic dashboard that pulls numbers from building management systems, tenant platforms, and business intelligence tools into one executive view. These dashboards genuinely help leadership understand how a portfolio is trending over a quarter or a year, though driving the next hour of work was never really the job they were built for.
ServeDeck’s own strategic dashboard for its commercial building maintenance system is a good example of what this layer is for: a customisable, real-time view across sites and modules, built so executives can see how the business is performing without digging through separate reports, a genuinely useful tool, though not one a technician standing in a plant room can use to work out what to fix next.
A report showing that maintenance costs rose 12% last quarter is useful for budget planning. It tells an engineer nothing about which asset needs their attention this afternoon.
The Limits of Strategic Dashboards on Their Own
Three problems tend to show up once a strategic dashboard is treated as the whole solution rather than one layer of it.
Setting one up properly usually means custom integrations and ongoing data mapping before anyone sees a useful number, which pushes the payoff further out than most teams expect. Once it’s running, the view tends to lag behind reality, because these dashboards are built around historical trends rather than live conditions, and a facility team managing today’s priorities needs to know what’s happening now, not last month.
Because the dashboard sits apart from where the actual maintenance work happens, records fall out of sync. Updates get made in one system and never reflected in another, and the people relying on the dashboard end up trusting numbers that are already stale.
None of this makes strategic dashboards a bad investment, just an incomplete one on its own.
What Operational Dashboards Are Actually For
This is the layer a Computerised Maintenance Management System (CMMS) is built to cover. It connects assets, work orders, technicians, vendors, and maintenance schedules inside one system that reflects what’s happening as it happens, not what happened last month.
The difference comes down to what each system is designed to answer, not which one has better charts. A strategic dashboard tells you how the business is performing. An operational dashboard tells a team what needs to happen next and gives them the tools to act on it without switching systems.
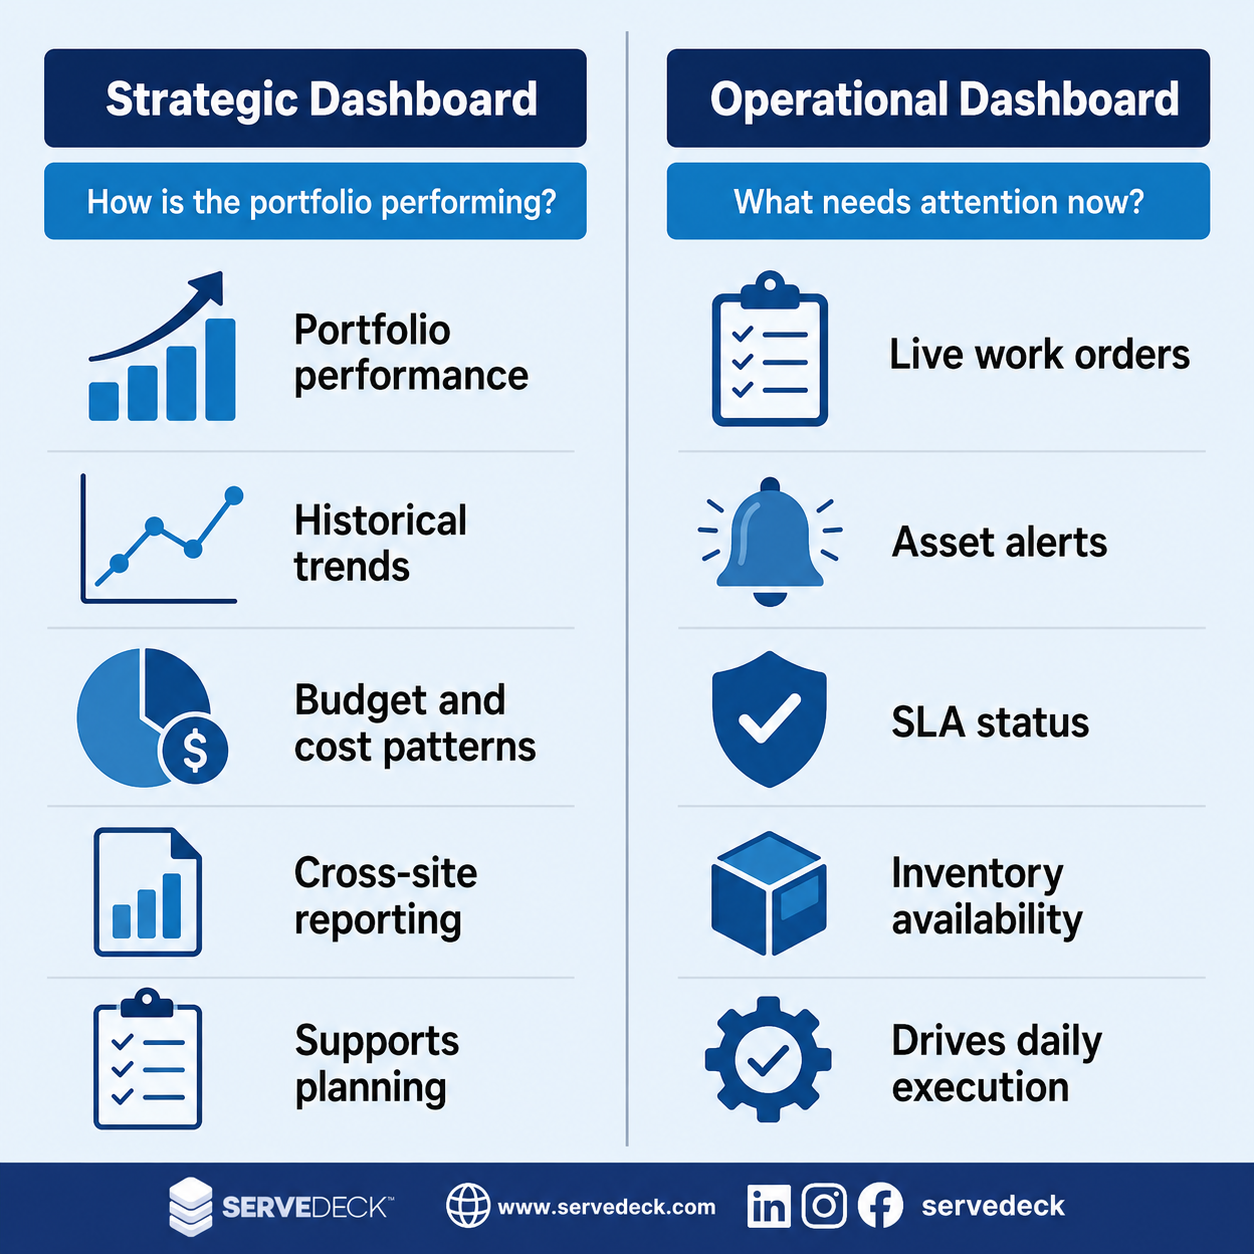
That distinction plays out across a few areas in particular. Asset health tracking surfaces early warning signs in maintenance history and performance trends, which is the core of the preventive vs corrective maintenance decision: catching a fault early enough that it’s a scheduled job instead of an emergency callout.
SLA tracking built into the same view means a delayed job gets flagged before it breaches, rather than showing up in a report after the fact. And visibility into spare parts and inventory levels stops maintenance work from stalling because nobody realised a part was already out of stock.
How This Plays Out Across Different Operations
In retail and shopping malls, property teams use this kind of visibility to track tenant requests, asset conditions, and vendor response times together, which shows up directly in tenant satisfaction scores.
Enterprise facilities managing multiple sites get a single view of preventive maintenance schedules and contractor performance across locations that would otherwise need separate reports pulled from separate systems.
Field service teams, working through mobile access rather than a desk terminal, can update a job, log an asset condition, or close out a work order from wherever they’re standing, so the record reflects reality the moment the work is done rather than hours later at end of shift.
A Live Example
One ServeDeck client, a large Malaysian organisation managing a multi-storey headquarters building, runs both layers from a single platform. The strategic dashboard covers:
- Visitor traffic and site activity
- Work orders by status, department, and type
- SLA performance, tracked live rather than reported after the fact
- Vendor contract standing and permit-to-work activity
- Utility consumption, tracked against cost rather than usage alone
- Inventory levels feeding back from day-to-day maintenance work
Leadership gets the portfolio-level view. The operational data underneath it updates from the same platform in real time, instead of being reconstructed from separate systems at month-end.
Bringing Both Layers Together
One answers how the business is performing, the other answers what needs to happen next, and a facility team needs both. The strongest setups don’t pick a side.
A strategic dashboard gives leadership the holistic, cross-site view they need for planning. A connected CMMS gives frontline teams the live execution data they need to act.
When both draw from the same centralised platform instead of sitting as separate systems, the reporting layer and the operational layer stay in sync, and the gap between having data and having answers closes.
Key Takeaways
- Strategic dashboards show how a portfolio is performing over time. They weren’t built to tell a technician what to fix in the next hour.
- Treating a strategic dashboard as the whole solution leaves teams working from data that’s slow to set up, lagging behind live conditions, and prone to falling out of sync with day-to-day maintenance records.
- Operational dashboards, built on a connected CMMS, close that gap: live asset health tracking, SLA visibility, and inventory status in one place.
- The two layers work best together, not as a choice between them. Strategic dashboards support planning; operational dashboards drive execution.
SHARE THIS POST:
Comments (0)
Leave a Reply
Your email address will not be published. Required fields are marked *